Know which stocks are in season — before the move
Screen 4,500+ securities for seasonal patterns with proven win rates — and see which ones are running hot right now, not just on average.
Free account · Screener preview included · No credit card required
How it works
From screening to execution in three steps.
Screen
Find the strongest seasonal setups across 4,500+ securities, ranked by efficiency and win rate.
Analyze
Check win rates, equity curves, and cycle timing. Know the statistical edge before you enter.
Trade
Use the calendar to plan entries and exits. Every setup shows historical performance and exit targets.
Built for serious traders
Every tool designed to give you a statistical edge in the market.
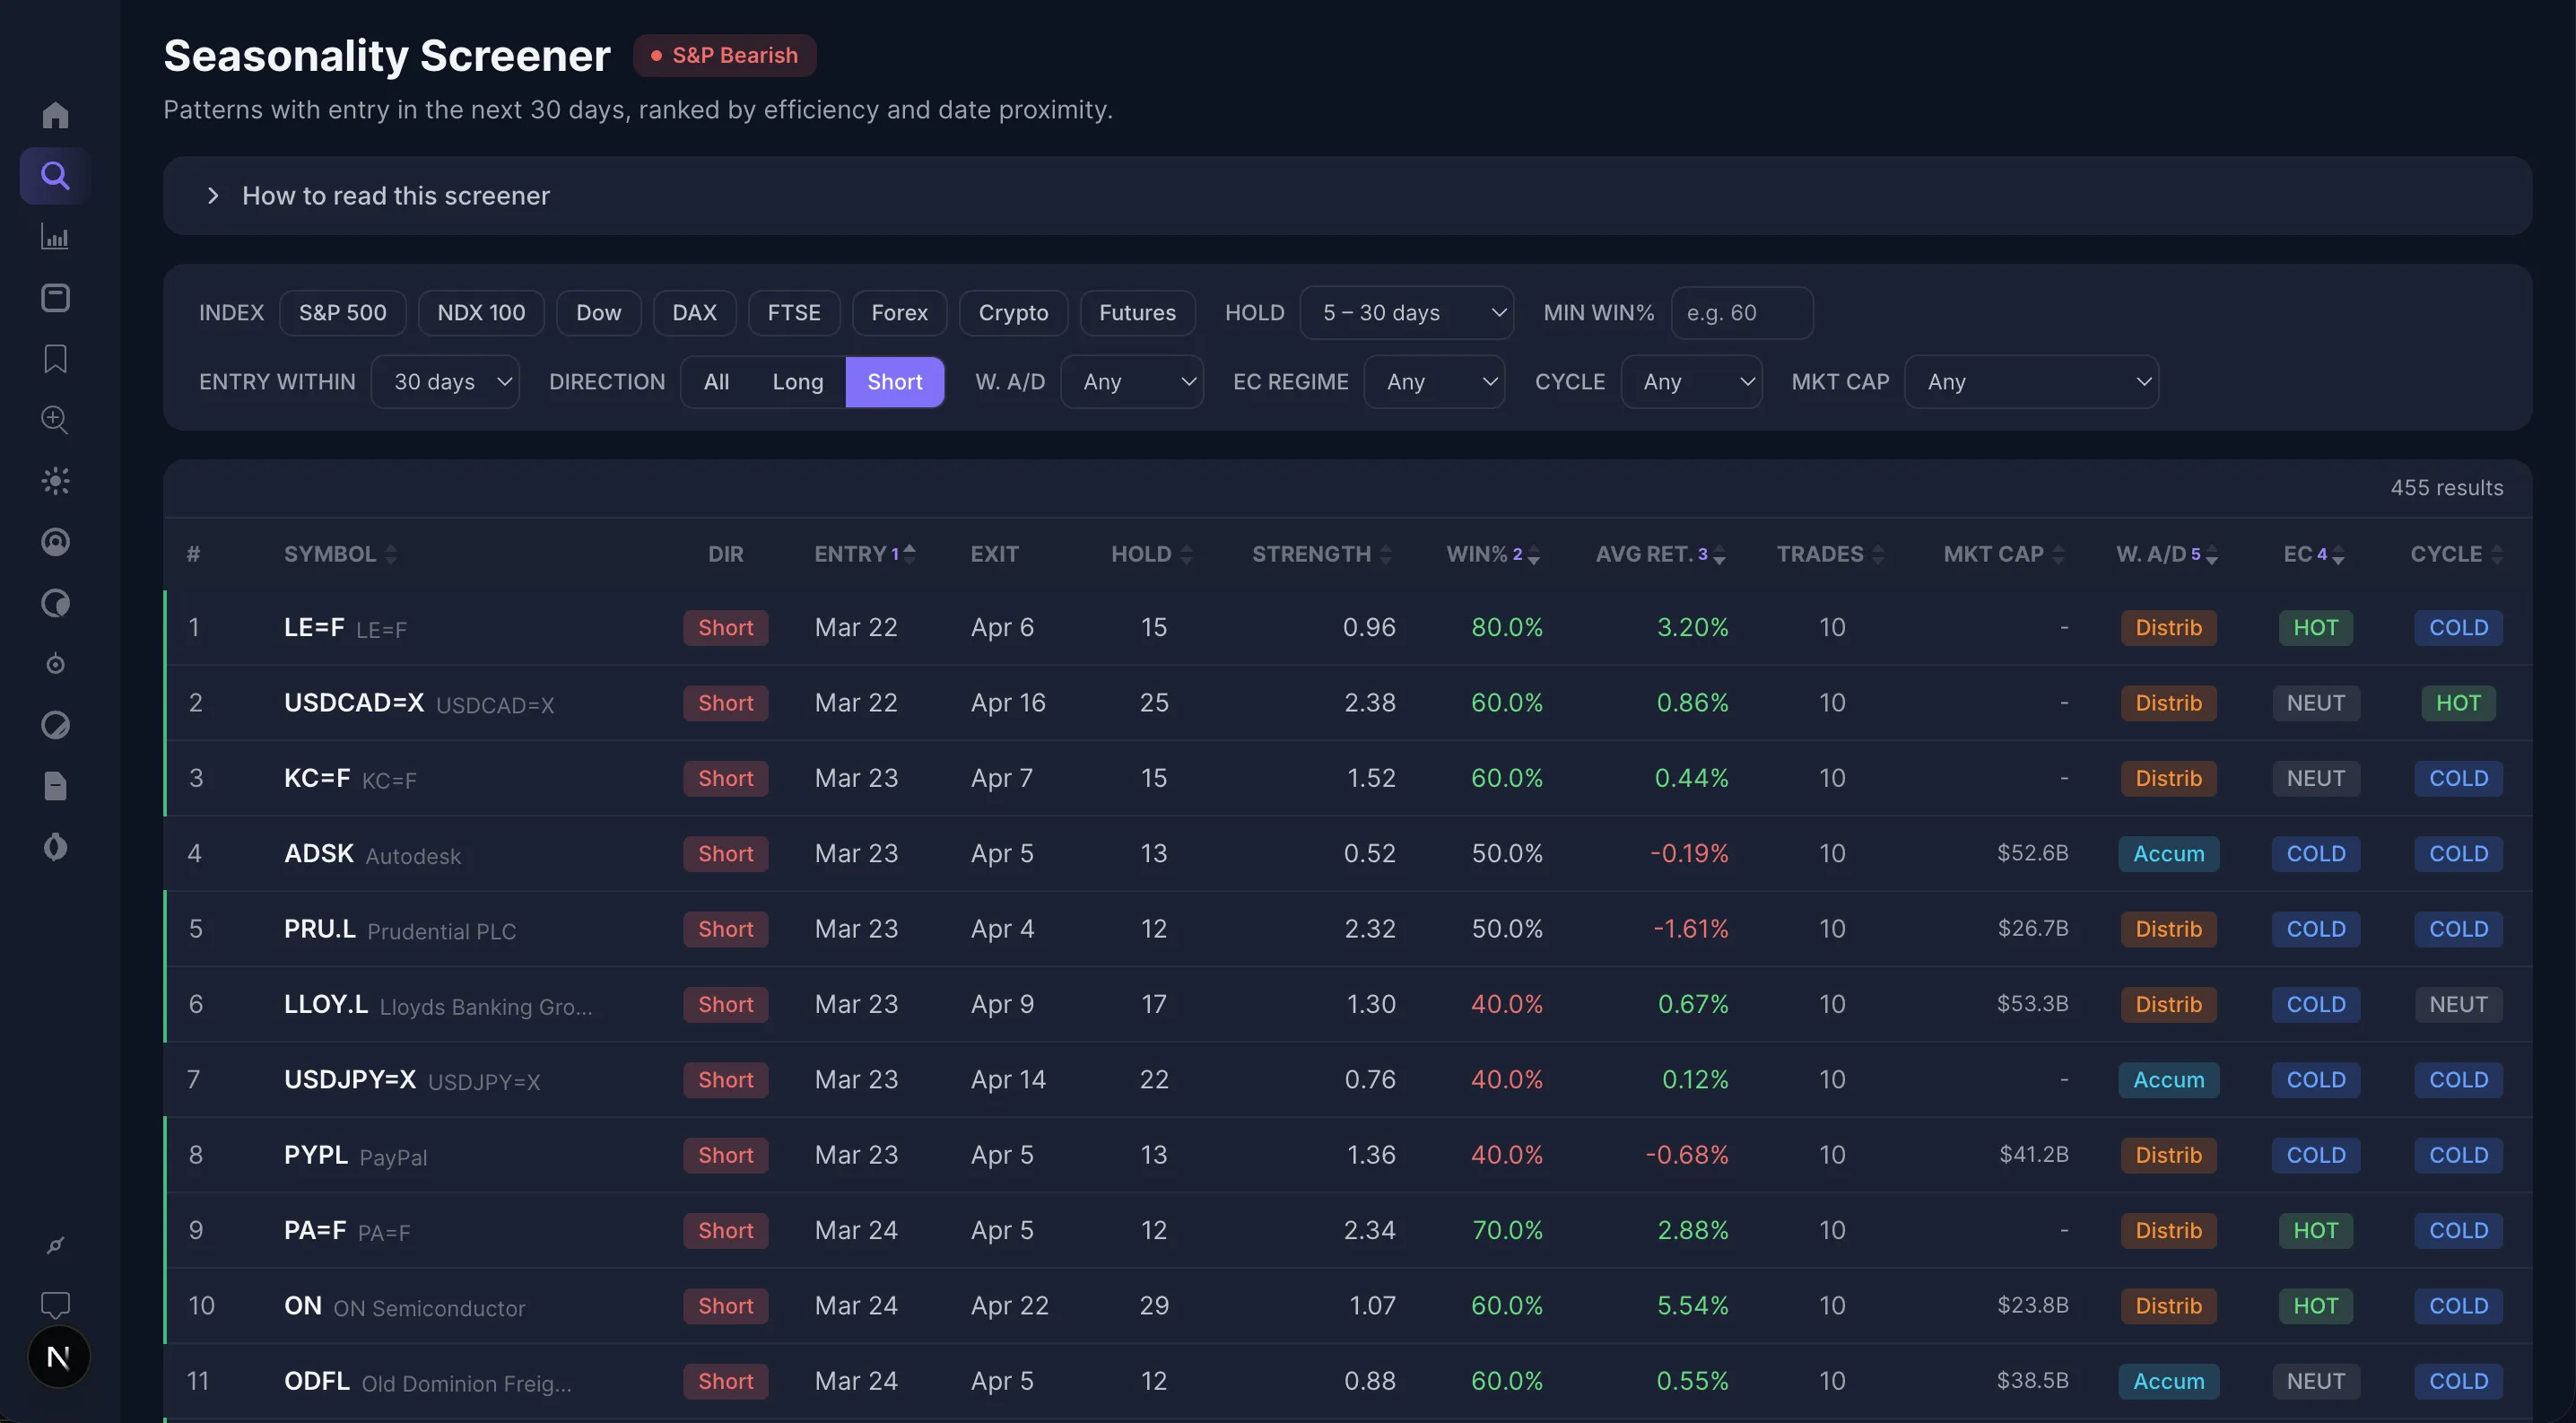
Screen thousands of stocks in seconds
The Seasonality Screener ranks every symbol by efficiency and date proximity, surfacing the strongest upcoming trades. Filter by direction, regime, accumulation/distribution, and win rate.
Get started| # | Symbol | Dir | Entry | Exit | Hold | Eff. | Win% | Avg Ret. | Trades | W. A/D | EC |
|---|---|---|---|---|---|---|---|---|---|---|---|
| 1 | AAPAdvance Auto Part... | Short | Mar 1 | Mar 6 | 5 | 4.72 | 50.0% | 0.00% | 24 | Accum | NEUT |
| 2 | ALOTAstroNova, Inc. | Short | Mar 1 | Mar 10 | 9 | 4.64 | 38.9% | -0.20% | 36 | Distrib | HOT |
| 3 | APWCAsia Pacific Wire &... | Long | Mar 1 | Mar 9 | 8 | 3.89 | 59.1% | 6.29% | 22 | Distrib | NEUT |
| 4 | AGIGAbundia Global Im... | Long | Mar 1 | Mar 8 | 7 | 3.18 | 33.3% | 21.99% | 24 | Accum | NEUT |
| 5 | AGM-AFederal Agricultural... | Long | Mar 1 | Mar 6 | 5 | 3.10 | 37.5% | -0.60% | 32 | Distrib | HOT |
| 6 | BELFABel Fuse Inc. - Clas... | Long | Mar 1 | Mar 9 | 8 | 2.36 | 50.0% | 1.31% | 36 | Accum | NEUT |
| 7 | BCHBanco De Chile ADS | Long | Mar 1 | Mar 12 | 11 | 2.26 | 56.5% | 0.46% | 23 | Accum | HOT |
| 8 | ARWRArrowhead Pharma... | Short | Mar 1 | Mar 26 | 25 | 2.24 | 43.8% | -9.03% | 32 | Distrib | HOT |
Seasonal charts that reveal hidden patterns
Overlay decades of price data to see exactly when markets tend to rise or fall. Our seasonality engine analyzes daily, weekly, and monthly return patterns so you can spot recurring opportunities.
Get started| # | Dir | Entry | Exit | Move | Days | Pts/Day | Efficiency |
|---|---|---|---|---|---|---|---|
| 1 | Long | Jan 20(0) | Feb 7(27.9) | 27.9 | 18 | 1.55 | |
| 2 | Short | Jan 4(16.5) | Jan 20(0) | 16.5 | 16 | 1.03 |
A calendar built for strategy execution
Every trade entry, exit, and outcome plotted on an interactive calendar. Color-coded by strategy, filterable by symbol, and updated daily.
Get startedBuild your personal seasonal watchlist
Select entry and exit dates on any stock's seasonal chart, backtest the window instantly, and save it to your watchlist. Track setups across multiple symbols.
Get startedSimple, transparent pricing
Three plans. 14-day money-back guarantee. Cancel anytime.
Seasonal Edge Alerts
The week's best seasonal setups, in your inbox
+ applicable taxes
- Weekly Sunday email of 100%-win-rate setups*
- S&P 500, Nasdaq & Dow constituents
- Full interactive report for every alert
- No screening required — we send you the best seasonal patterns automatically
*Win rates are historical. Past performance does not indicate future results.
Seasonal Edge
Most PopularEverything you need to trade seasonal patterns
+ applicable taxes
- Seasonality screener across 4,500+ securities
- Seasonal trend charts with yearly overlays
- Watchlist & trade calendar
- Strategy analytics & equity curves
- Take-profit / stop-loss exit optimization
Seasonal Edge Pro
Build and backtest custom astrological strategies
+ applicable taxes
- Custom astrological strategy builder
- Backtest across any planet & aspect combination
- Equity curve & regime analysis
- Take-profit / stop-loss optimization
- Upcoming signal alerts
- Everything in Seasonal Edge included
Questions
Get the free Sunday newsletter
Seasonal market research and commentary, delivered every Sunday. No spam, unsubscribe anytime. Want every 100%-win-rate setup with full reports? That's Seasonal Edge Alerts.
Ready to see the edge?
Join traders using seasonal patterns to find data-driven opportunities across the market.